
You probably won’t find a GPS track for the Yukon River Quest, and if you do, you probably won’t find a good one. The teams that have a good track are likely to keep it close to their chest because it’s an encyclopaedia of river knowledge.
So how do we get a useful GPS track the the YRQ?
You could get one from a friendly paddler who has completed the event before. They are out there, but they may not be accurate. Of the few I’ve seen, they all have some anomaly where the paddler got lost, or stopped for a pee in the bushes. We’re after a fastest race track, not a tour of last years toilet stops.
The race tracker for the event has a great animated display where you can see boats move along the river past the various river features. It works by receiving the SPOT tracker checkins that are transmitted by the boats at five to ten minute intervals.
Assuming you could follow the winning team down the river step by step, you probably still won’t have a good track. You could watch the animation to see where the boat goes, but with checkins every 5 minutes, at Yukon speed those locations can be 6km apart. It’s often impossible to know where they were in the shorter river channels.
Even the teams that did finish well, may not have taken the best path all the time. If you track the winning teams, you’ll find them in odd places at times. There are also breaks in the tracks of many boats where their SPOT trackers just stopped transmitting. The race tracker is not a testimonial to the reliabilty of SPOT trackers in the field.
And you can’t draw a line between checkin locations because the checkin points are too far apart and the line will have you leaving the river.
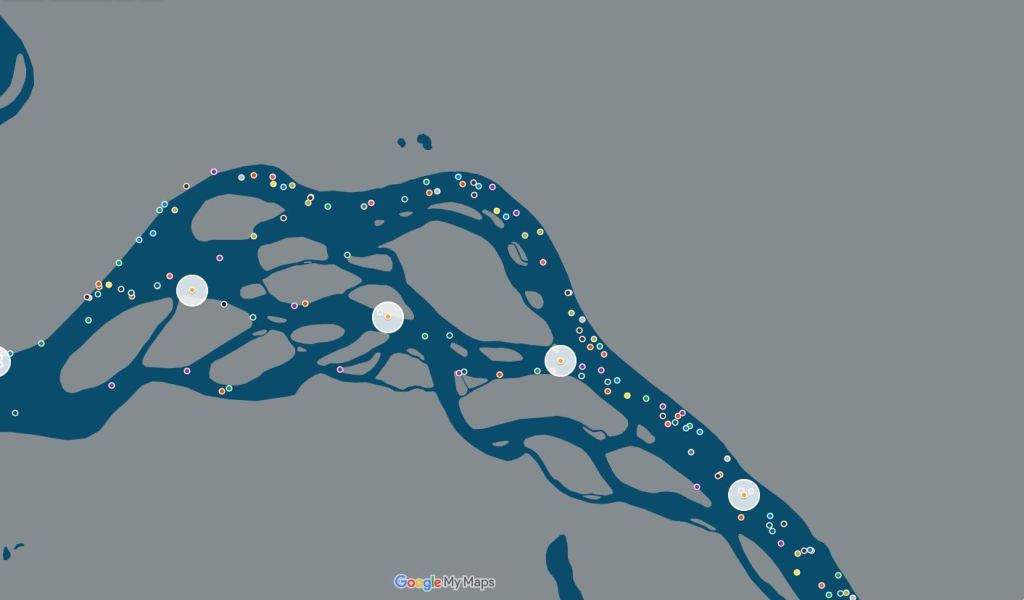
The answer lies in looking at the SPOT tracker data in a different way. Rather than looking at the animation of the boat positions played back over time, we need to see all of their positions like footprints in the snow.
Once we can see more than just the current position, we can see more clearly where the best channels are. But we can’t trust just one boat, because at some point, everybody deviates from the line. What we want to do it crowd source the course from lots of boats and then weight the positions according to how successful the boats were in the race.
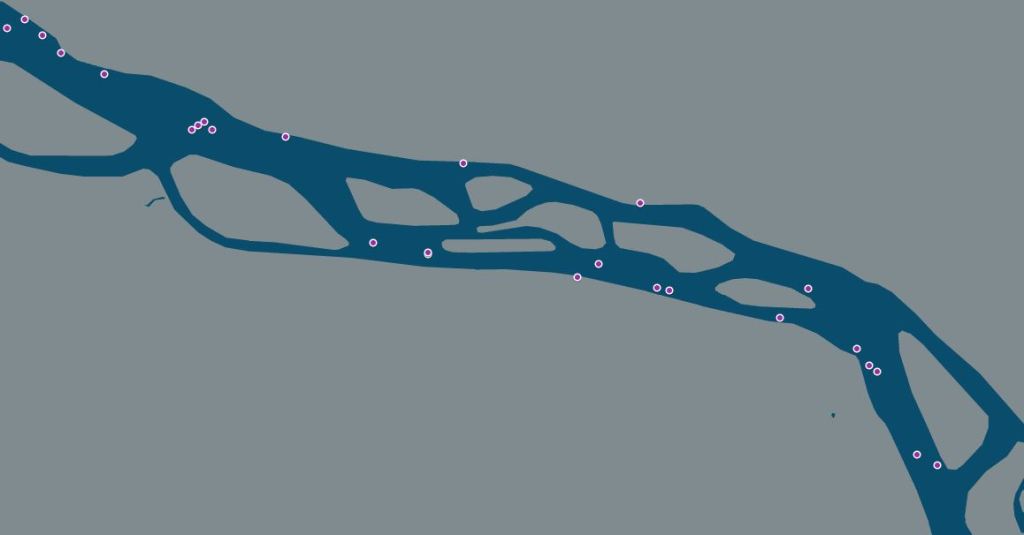
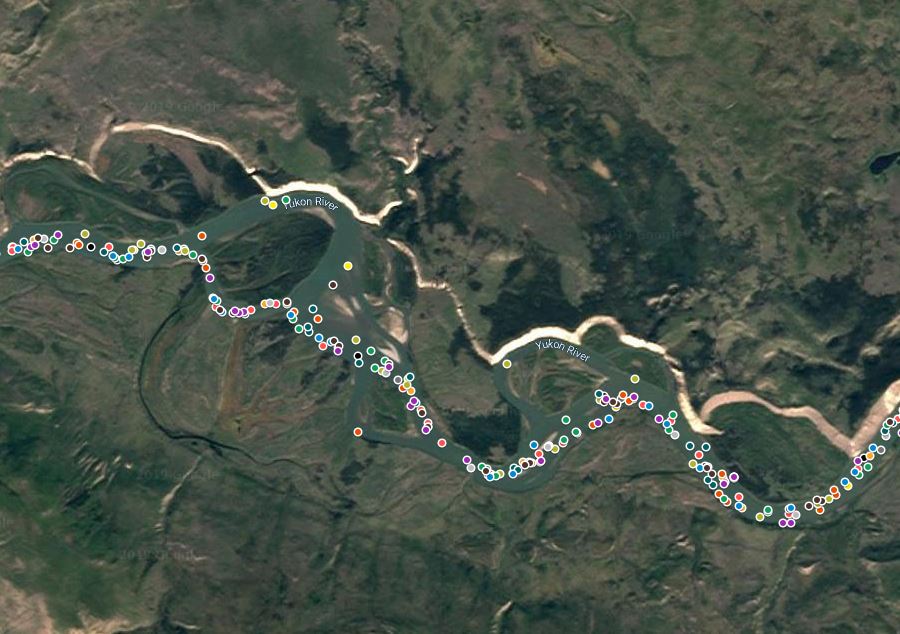
So with a little data magic we start painting the positions on the map. The map above shows four teams from the middle of the 2018 field entering a section of river somewhere past Carmacks. We can see that there are several checks from multiple boats in the river-left channel (lowest in the map), but there’s at least one boat that’s chosen to go river-right.
From the four teams shown, the tracks from the fastest team went river-right.
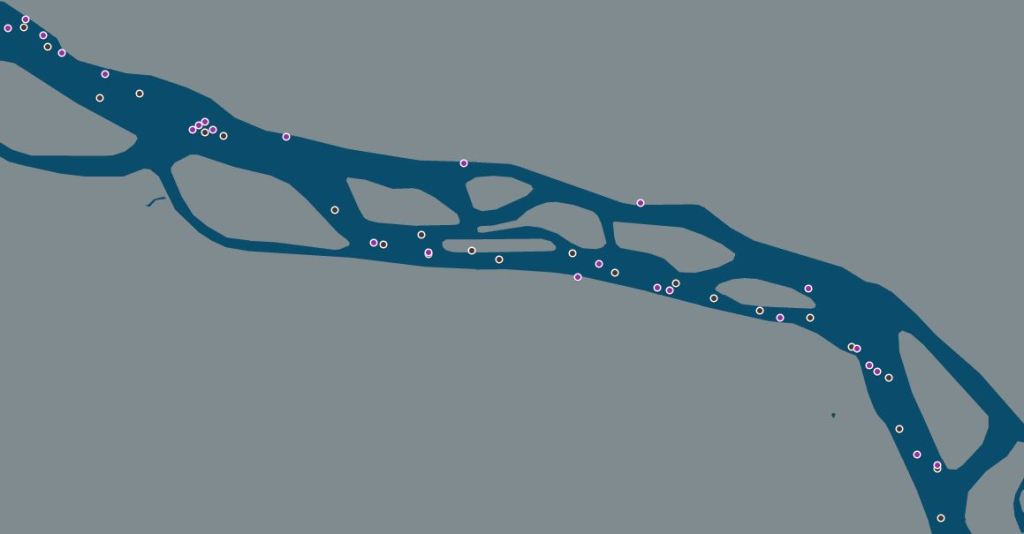
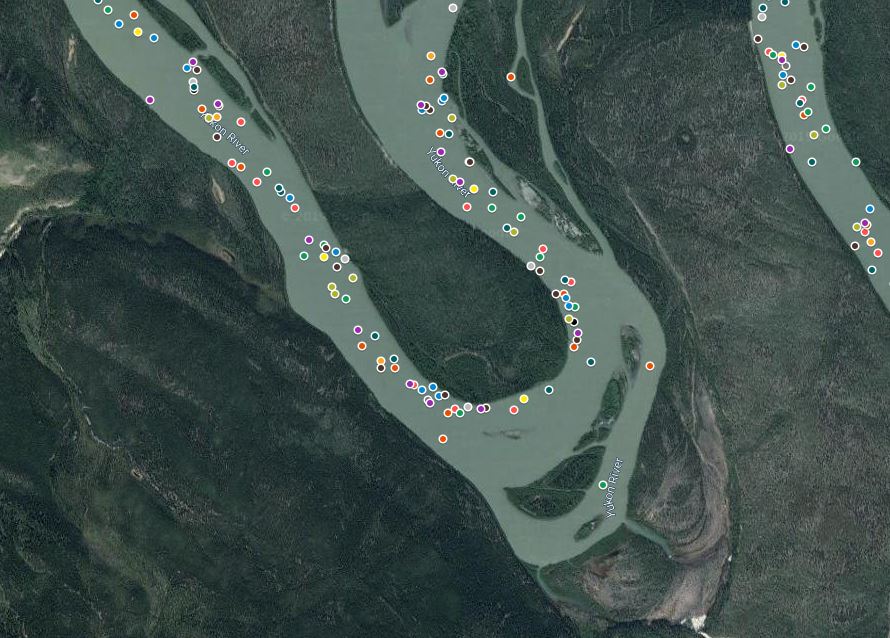
So we add some more boats to get some more points. Still most of the boats have gone left. As the tracking dots get closer together, we start to see a trend emerge in which channel is preferred.

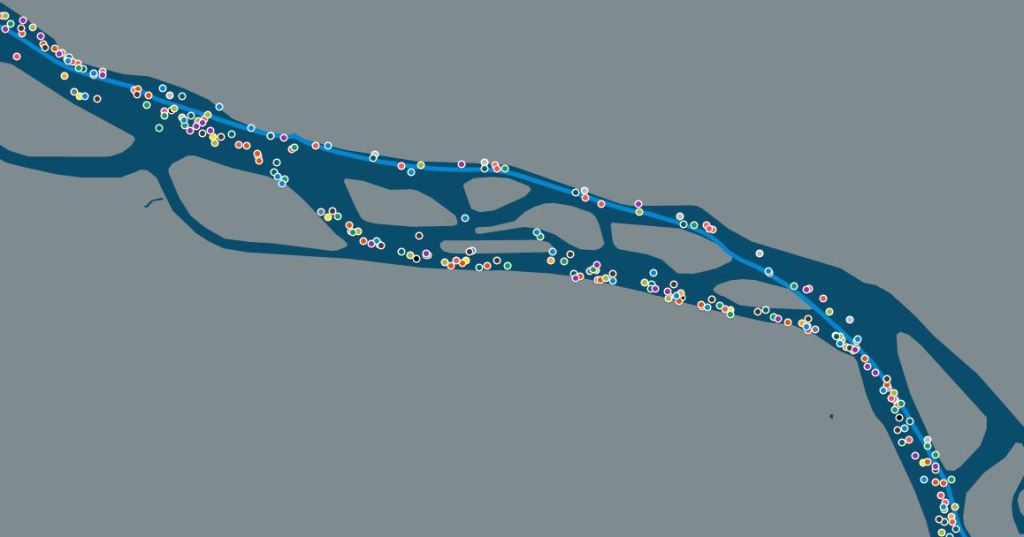
If we add the tracking points from a lot more boats, we can see some patterns start to emerge. There are now almost enough dots to step from location to location with some confidence. At the same time, we see more deviations. There are now several boats which have chosen river-right, and a couple that have popped up in the middle channels.
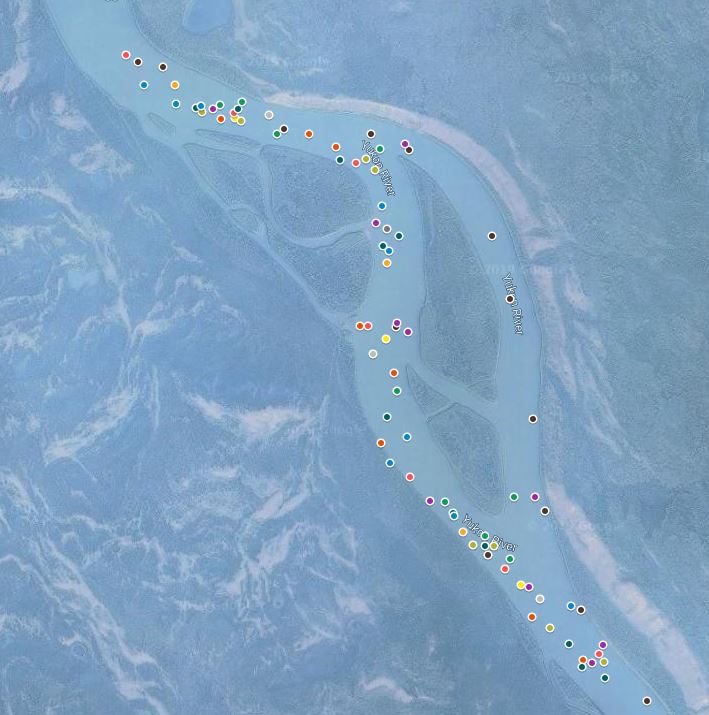
We now have tracking points from the 40 fastest boats in the race (excluding withdrawls and boats which stopped tracking).
Both channels make sense in terms of the terrain. A sweeping left into a sweeping right. Either side could be faster. Did the bulk of the boats simply take the first channel, while a small selection with more local knowledge ran a faster route on the right?
Plotted against one of the two good GPS tracks I managed to locate, the right choice would be river right…
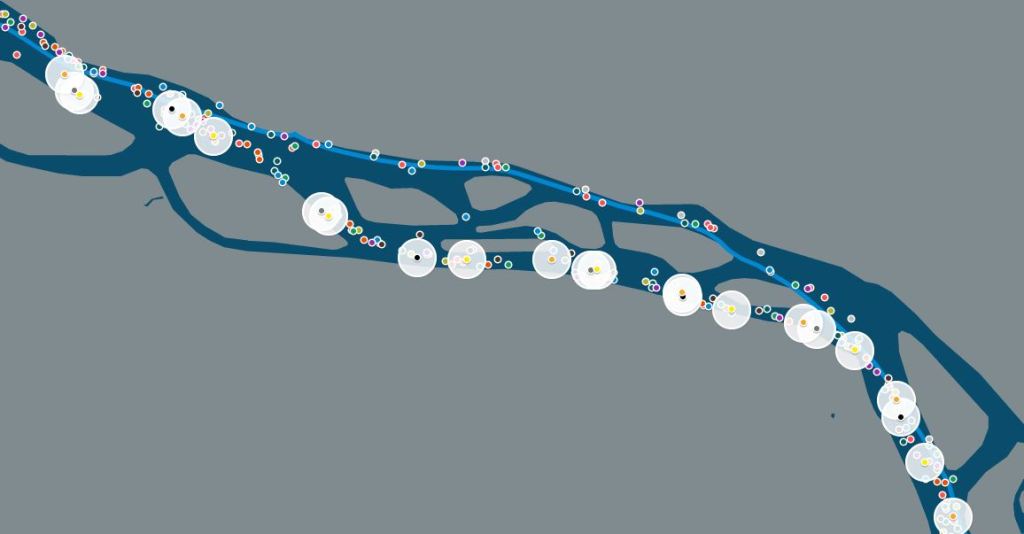
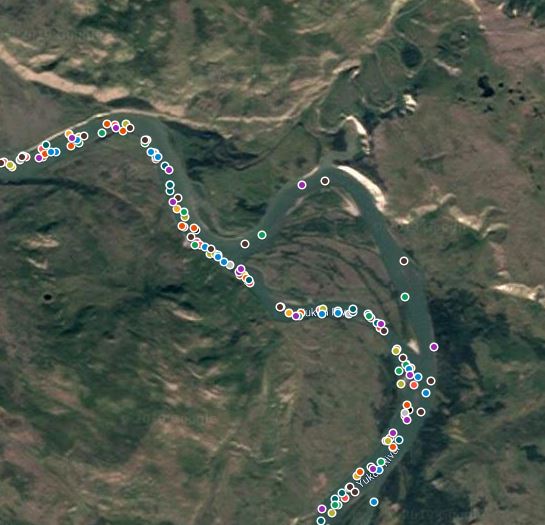
But if we highlight three of the fastest boats from the field, it’s clear that their choice is the river left path. That’s where we want our track to go.
And so, we repeat that process for the entire 700km of the Yukon River Quest

A little like the race itself, you do that lots and lots of times, and eventually you get to the finish line.
Where we don’t want to be
As a byproduct of building a better route I’ve assembled a little rougues gallery of teams that have gone astray. I’ll probably never know why they were off the main course, but I do know they weren’t in the top finishers.
The lesson is clear. Be careful who you follow on the river. Being in front of you, doesn’t mean they know where they’re going.

Help encourage more posts by buying Steve a coffee…
Choose a small medium or large coffee (Stripe takes 10% and 1% goes to carbon reduction)
Or enter a custom amount
Your contribution is appreciated.
Donate
Would you be able to do this for the Ausable river canoe marathon? They have used SPOT trackers since 2015 so I’m confident there would be plenty of data points. I would really be interested in learning how you did this so i could try and make a track for the ausable
LikeLike
there are already GPS tracker for the Ausable. I’ve converted and loaded them for the Aussie teams over the past three years.
it’s possible, but there’s a limit to how many locations you can get Google Maps to display.
LikeLike
Joe said he has the data files for one of the years. But won’t give them to me for some reason? I totally could do this. If you can get the spot data files I’ll do it.
LikeLike
Been wanting to do this for the marathon for years
LikeLike
I have a few problems with your theory. 1. The most popular line is not necessarily the fastest line, unless you have data to prove it. 2. The fastest line is usually where the deepest water/ fastest current is. That is usually the outside line through a turn in the river as long as you stay in the main channel. Granted, sometimes cutting to the inside can be faster if you are covering a lot less distance. 3.The strongest paddlers may win even if they pick bad lines, but how would you know if this was in fact the case? It’s a fascinating race with a lot of variables.I wonder if there are lessons to be learned from other ultra endurance races like the Race Across America, like sleep strategy.
LikeLike
1) as I mentioned in the article, I favoured the fastest boats, not the popular route. there are always some fast boats that don’t know about certain cuts.
2) I would say that the popular line or even your conventional around the outside the bend line is often not the fastest line when the Yukon River valley is miles wide in places. We ducked into a couple of these shortcuts in 2019 and popped out 3-5kms ahead of similarly paced teams who took the traditional line.
from the points and the timings, it’s pretty apparent that some fast teams will follow another boat that is ahead of them (standard if they’re in front of me, they must know where they’re going logic)
I shared my route with the fastest K2 team from 2018 and 2019 and there were three that they didn’t know about, but do now.
3) I used a majority of fast boats weighting to discard fast boats who simply didn’t know about the cuts. I also preferenced teams that were locally based and had consistently placed well.
There’s plenty of room to refine the approach. You could determine the location of each spot message against progression along the course (bearing in mind that locations are 10-15 minutes apart and a straight line would often be through a hillside. Then weight the choices of the boats that had progressed the fastest over a 5km sliding window of the course to determine prefereed spot location.
I wanted a track that would give us a default track, which we could then read the water against and make on the spot judgements. It worked for us. We stayed on the course and came in as second mixed K2 despite a number of other logistical mishaps.
LikeLike
Thanks for the clarification. Sounds like you have spent some time thinking about all this ! Always good to race smart when there’s that much pain involved !
LikeLike
This is really interesting and thank you for publishing. We are returning again next year for the race and I wondered if you would be able to release the data for Boat 87 from this year? As a team we are coming to set a good time and data like this would be invaluable for our quest to become quicker
Thanks in advance
Ben
LikeLike
YRQ shared this post which was actually an “explainer” for a reference in a post about our 2019 YRQ
The master post includes links to this, the maps, and also our GPS track from 2019.
I’d have to go back and look to see if #87 made the cut for inclusion in the analysis. there’s a limit to how many data points Google Maps can import and display, especially as they are points, not joined up as a track.
LikeLike
team #87 would be in this view https://drive.google.com/open?id=1AG29TMvvZmJyL9x2F5fMJEKfk-jj_swJ&usp=sharing
LikeLike